For Loops and If-Else Statements
This post focuses on how to write a simple for loop and an ifelse statement
The anatomy of a for loop
For loops are a great way to run an iterative process over an over again. You can use them to make calculations or create a bunch of plots using minimal code. Note, however, that using the many apply functions in R (e.g., sapply, tapply, lapply, mapply, aggregate, by, etc.) may be more efficient than for loops for certain types of calculations. There is a great discussion on when to use apply functions versus loops here on page 46. Today, however, we are going to discuss how to write a simple for loop.
For loops have two major parts: an indexing statement and a command (or set of commands) to repeat. The command looks like this:
for (index in sequence){
command to repeat
}
You always start you loop with for. The index can be any character. Many people often use i or ind for index. The sequence can be a sequence of numbers, such as 1:15 or c(1,4,6,8,9). This is the iteration that you will be looping over. In between the brackets is the command that you want to repeat.
Calculate something iteratively
One common reason to use a for loop is to calculate something over and over again. Today, we are going to use pH data collected from tide pools and the ocean to practice for loops. I collected pH data from 15 different tide pools as well as an adjacent ocean sample every hour for 6 hours during the day and during the night. One metric that I am interested in calculating is the average difference in pH for each pool relative to the ocean.
The below dataset has 5 columns: Date, Day.Night, Time.pt, Pool, and pH. Date is the collection date, Day.Night is whether the sample was collected during the day or night, Time.pt is the sampling time point from 0 to 5 (time 0 to time 5), Pool is the pool ID number from 1:15 or Ocean, and pH is the pH data.
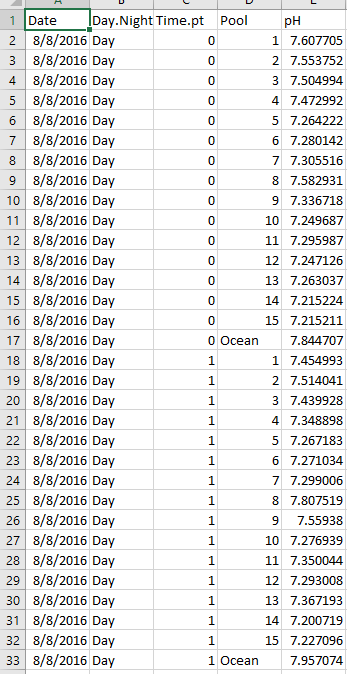
Let’s load and check out data.
####################################################
# Script to create for loops from Nyssa's pH data   #
# Created by Nyssa                                 #
# created on 1/31/2017                             #
####################################################

## clear workspace---------
rm(list=ls())

## set working directory------
setwd(getwd())

# load libraries------------------

## Load Data-------------
Data<-read.csv('Data/NyssaData.csv')

## Data analysis-----------------

# clean the data--------------
# check the data
head(Data)
tail(Data)
Our first for loop today will calculate the difference between the pH in a pool and the adjacent ocean sample across all time points and then take the average. Before we start the for loop though we need to allocate space for the output. There are two different ways to do this. The first is to just assign NA to a new object. For example, if I want my new object to be called NetMeanpH it would look like this:
NetMeanpH<-NA
While this will work, it is not a great way to allocate space because R does not know how long the new object should be and, therefore, it could take a long time for the code to run. A better way is to specifically tell R how long your new vector or matrix will be and to fill it with NAs. My dataset has 15 tide pools so I will want a vector with 15 rows. This is a better way to start:
NetMeanpH<-matrix(NA, nrow = 15, ncol = 1) #allocate space
I told R to create a matrix of NAs with 15 rows and 1 column. An even more elegant way would be to not hard code it and to put nrow = length(Data$Pool). But, because the dataset also has the ocean sample in the Pool column, this will not work.
If I were to calculate the difference between each Pool and Ocean sample one by one it would look something like this:
Data$pH[Data$Pool==1]-Data$pH[Data$Pool=='Ocean']
Data$pH[Data$Pool==2]-Data$pH[Data$Pool=='Ocean']
Data$pH[Data$Pool==3]-Data$pH[Data$Pool=='Ocean']
.
.
.
And then I would take the average of all those values. When you write a for loop it is good to start by just testing what you are trying to do first. This will help you form the loop. So, what is the iterative process above? It is the Pool number, which goes from 1:15. To turn the above into just 2 lines of code (instead of 16) we do this:
for (i in 1:15){

NetMeanpH[i]<-mean(Data$pH[Data$Pool==i]-Data$pH[Data$Pool=='Ocean'])

}
We start with the loop statement which goes from 1:15 (Pool 1 to Pool 15) then we have our new object called NetMeanpH which we pre-allocated above. Notice that there is a bracket with an i in it. This tells R which row to fill the data into. We want to fill it into row i. If i is 1 (for Pool 1) then the mean net pH will be added to row 1 of NetMeanpH and so on and so forth. Once it runs, you will have a matrix with all your data for all 15 rows and you’re done!
Plot something iteratively
For loops are also super useful for making the same plot over and over again. I am going to use this data to plot pH versus time for all 15 pools and the ocean.
First, I am going to create a new object called Pools. The gives me the unique name of all the pool IDs in my dataset (1:15 and Ocean).
Pools<-unique(Data$Pool)
I want to create a figure that has a different plot for every pool and the ocean where pH is plotted against the time point. Since there are 15 pools and the ocean sample, I want to create 16 subplots. Recall from last week that we can use the par function to do this
par(mfrow=c(4,4)) # subplots with 4 rows and 4 columns
Now let’s run a for loop to make 16 plots:
  for (i in 1:length(Pools)){ # plot over all the pools and the ocean. This will be 1:16

 plot(Data$Time.pt[Data$Pool==Pools[i]], Data$pH[Data$Pool==Pools[i]], # plot the time point as x and pH as y for each pool
         main = paste('Tidepool',Pools[i]), # give each title a unique name that says "Tidepool #"
		 xlab='Time Point', ylab = 'pH', # x and y labels
		 ylim = c(min(Data$pH, na.rm=TRUE), max(Data$pH, na.rm=TRUE)), # ylimits
		 pch=19, # I want them to be filled dots
		 )
  }
Here is what the plot looks like.
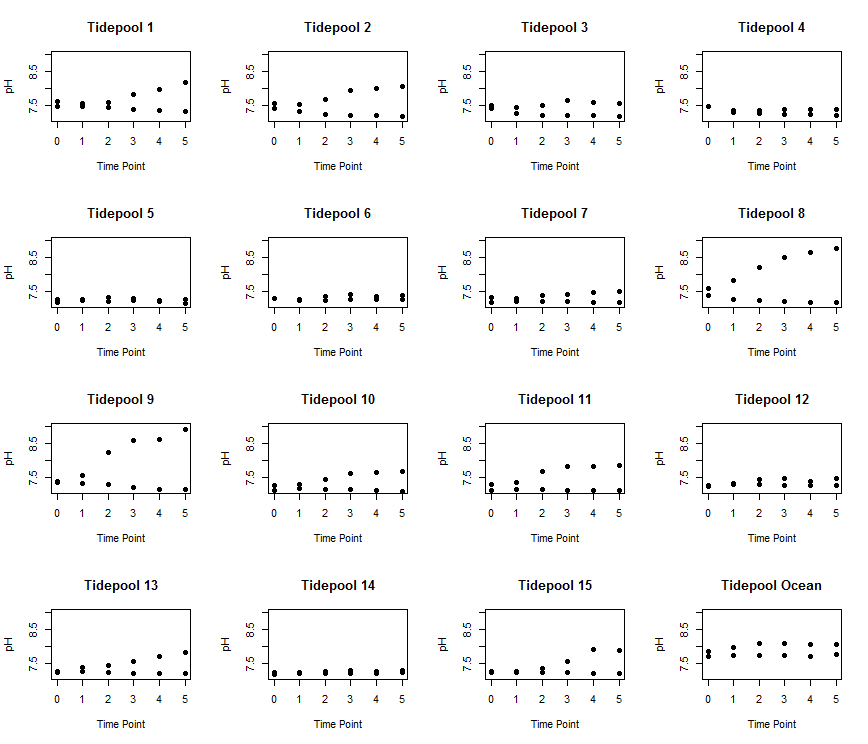
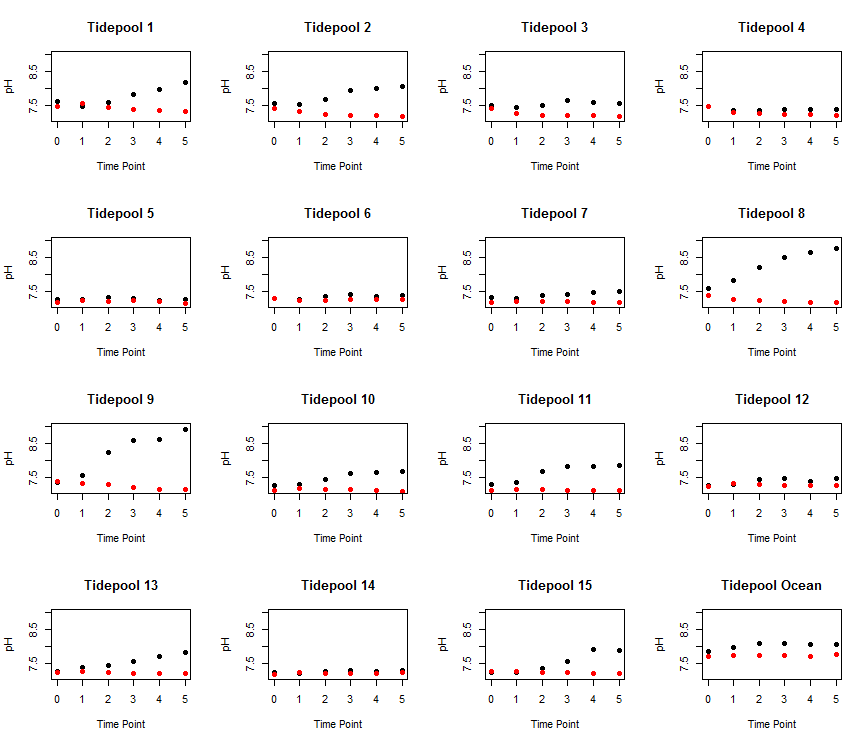
Now, let’s get fancy and also color the dots by day or night.
  for (i in 1:length(Pools)){ # plot over all the pools and the ocean. This will be 1:16

 plot(Data$Time.pt[Data$Pool==Pools[i]], Data$pH[Data$Pool==Pools[i]], # plot the time point as x and pH as y for each pool
         main = paste('Tidepool',Pools[i]), # give each title a unique name that says "Tidepool #"
		 xlab='Time Point', ylab = 'pH', # x and y labels
		 ylim = c(min(Data$pH, na.rm=TRUE), max(Data$pH, na.rm=TRUE)), # ylimits
		 pch=19, # I want them to be filled dots
		 col=Data$Day.Night[Data$Pool==Pools[i]]) # color the dots by day and night
  }
This code produces a figure that looks like this! This is way way better than writing the code for this figure 16 times, which will likely result in lots of copy and paste errors.
ifelse Statements
Lastly, I want to show you how to use a basic ifelse statement. Say we wanted to add another column to our dataframe that says weather the tide pool had a higher or lower pH than the ocean at a given time point. We can use the ifelse() function to put an ‘H’ for higher and ‘L’ for lower in a new dataframe. The ifelse function goes: ifelse(statement, put if true, put if false). Let’s add a new column to our dataframe called RelativepH. I want to put an H if the Pool pH is higher or equal to the Ocean and an L if it is lower.
First, allocate space.
Data$RelativepH<-NA # allocate space
I can just use NA here because it is already part of a dataframe so R knows how long it is suppose to be.
Now, let’s loop through all the pools using the ifelse statement.
for (i in 1:15){ # loop across the 15 pools
# put the H or L at pool i
Data$RelativepH[Data$Pool==i]<-ifelse(Data$pH[Data$Pool==i] >= Data$pH[Data$Pool=='Ocean'],'H','L')
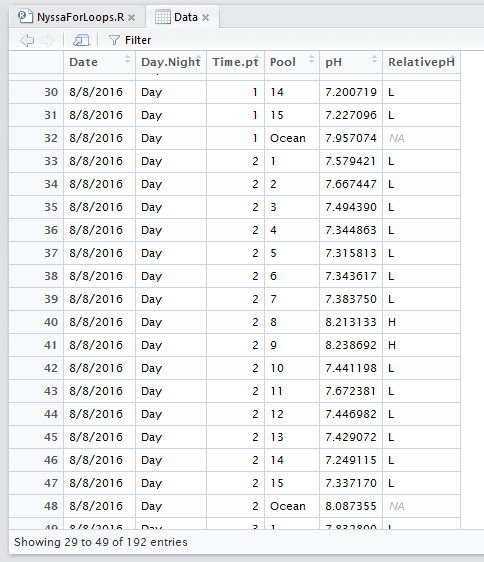
}
When we view our dataframe it now looks like this: